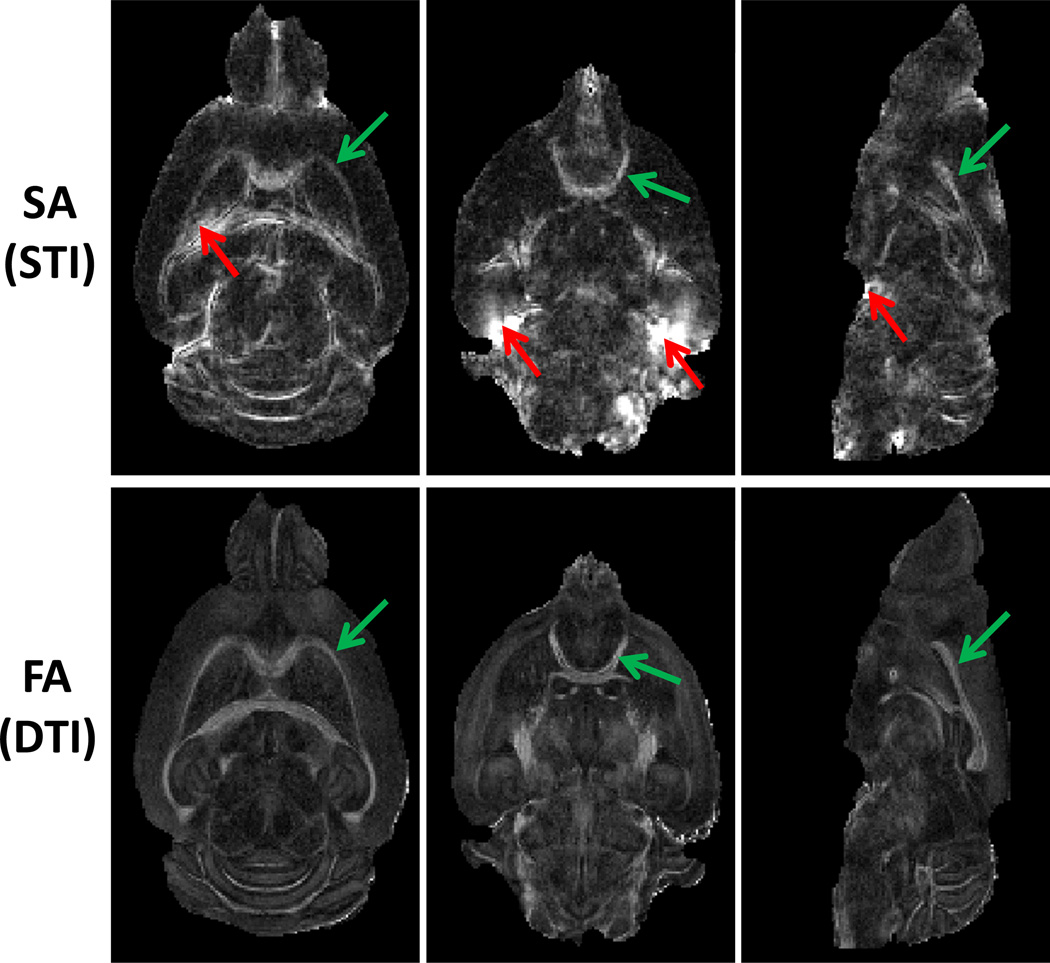
Fig. 4.
Representative images of susceptibility anisotropy and diffusion anisotropy. The green arrow pointed to regions with excellent quantification of both susceptibility and diffusion anisotropy. The red arrow pointed to regions with strong susceptibility anisotropy originated from the artifacts due to the strong susceptibility difference at the tissue interfaces.

