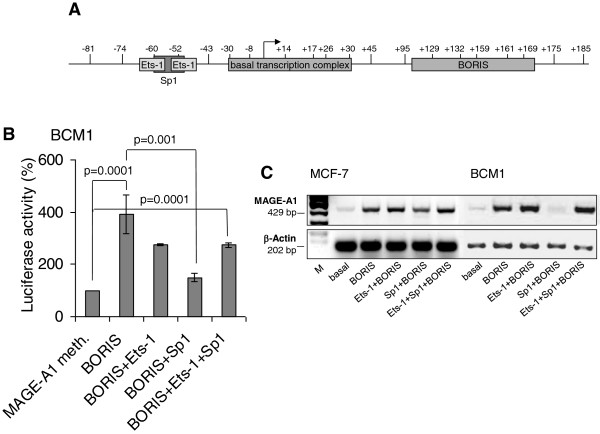
Figure 5.

MAGE-A1 promoter activity in basal and transfected cancer cells. Schematic view of the MAGE-A1 promoter fragment (-81/-185). The binding sites for Ets-1, Sp1 and basal transcription complex are indicated by grey boxes. The start site is indicated by an arrow. The vertical lines with the numbers mark the cytosine in the CpG dinucleotides (A). Luciferase activity of the HpaII-methylated plasmid containing the MAGE-A1 promoter fragment (-77/+183) in BCM1 cells which were transiently co-transfected with expression plasmids encoding for BORIS, Ets-1 and Sp1. The basal MAGE-A1 promoter activity was set to 100%. The activities derived from the reference plasmid encoding for the Renilla Luciferase were used to normalize the variability in transfection efficiency. The significant p-values are shown (B). Endogenous mRNA expression of MAGE-A1 in MCF-7 and BCM1 cells basal or transfected with expression plasmids encoding for BORIS, Ets-1 and Sp1 as determined by RT-PCR and gel electrophoresis. The housekeeping gene β-Actin was selected as an internal control due to the lack of influence of any stimulation involved (C).
