
Figure 1.
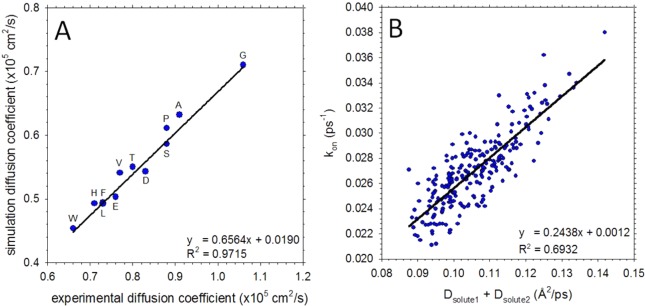
Translational diffusion coefficients and association kinetics of amino acids calculated from all-atom MD simulations. (A) Translational diffusion coefficients of 12 amino acids calculated from MD and compared to experimental data from Longsworth.97 Each symbol is labeled using the one letter amino acid code. (B) Plot showing the correlation between the calculated effective association rate constant (kon) and the sum of the individual amino acid translational diffusion coefficients. Each symbol represents a different amino acid pair.