
Figure 4.
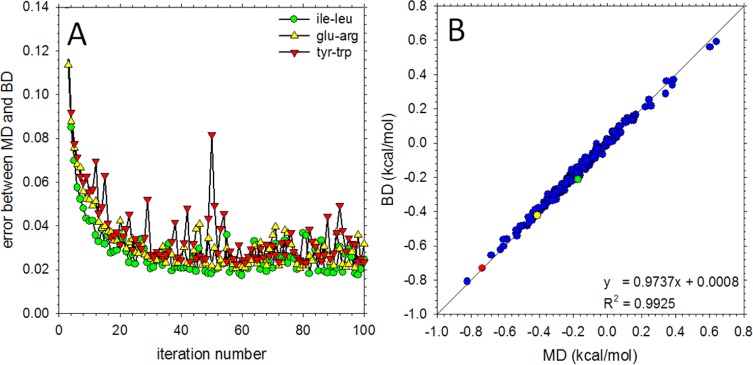
Derivation of COFFDROP nonbonded potential functions using the IBI method. (A) Plot showing the error in the nonbonded g(r) functions obtained from BD simulations as a function of IBI iteration number for the ile–leu (green circles), glu–arg (yellow upward triangles), and tyr–trp (red downward triangles) systems. (B) Comparison of binding affinities calculated from the Cα–Cα g(r) functions from MD (x-axis) and BD (y-axis). The green, yellow, and red symbols represent the ile–leu, glu–arg, and tyr–trp systems, respectively; the blue symbols represent the other 228 systems.