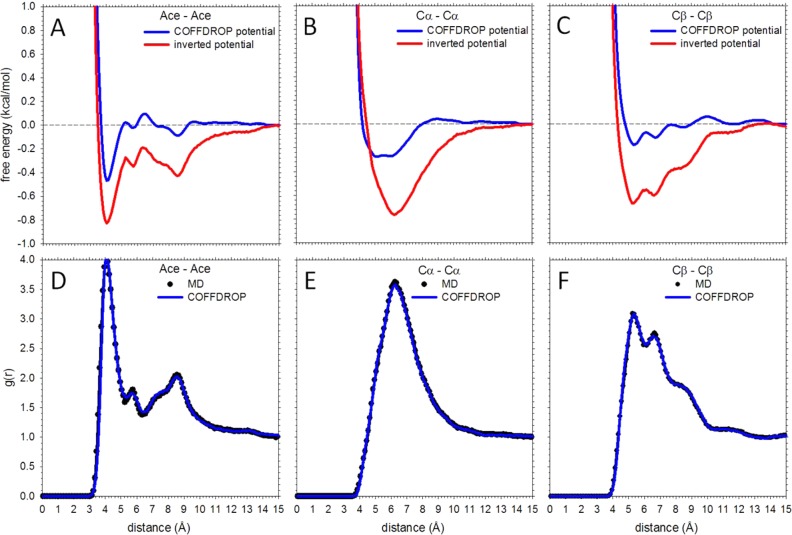
Figure 5.
Example nonbonded potential functions. (A) Plot comparing the Ace–Ace nonbonded potential function of the val–val system obtained from IBI (blue) with that obtained from noniterative Boltzmann inversion (red) of the MD g(r) function. (B) Same as A but for the Cα–Cα interaction; (C) same as A but for the Cβ–Cβ interaction. (D) Plot comparing the Ace–Ace g(r) of the val-val system obtained from MD (black circles) with that obtained from BD using COFFDROP (blue line). (E) Same as D but for for the Cα–Cα interaction; (F) same as D but for the Cβ–Cβ interaction.

