
Figure 7.
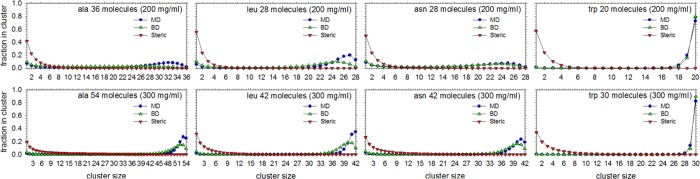
Clustering of alanine, leucine, asparagine, and tryptophan solutions at concentrations of 200 and 300 mg/mL in MD and BD. Same as Figure 6 but showing results for much higher concentrations.
Official websites use .gov
A
.gov website belongs to an official
government organization in the United States.
Secure .gov websites use HTTPS
A lock (
) or https:// means you've safely
connected to the .gov website. Share sensitive
information only on official, secure websites.
Clustering of alanine, leucine, asparagine, and tryptophan solutions at concentrations of 200 and 300 mg/mL in MD and BD. Same as Figure 6 but showing results for much higher concentrations.