
Figure 8.
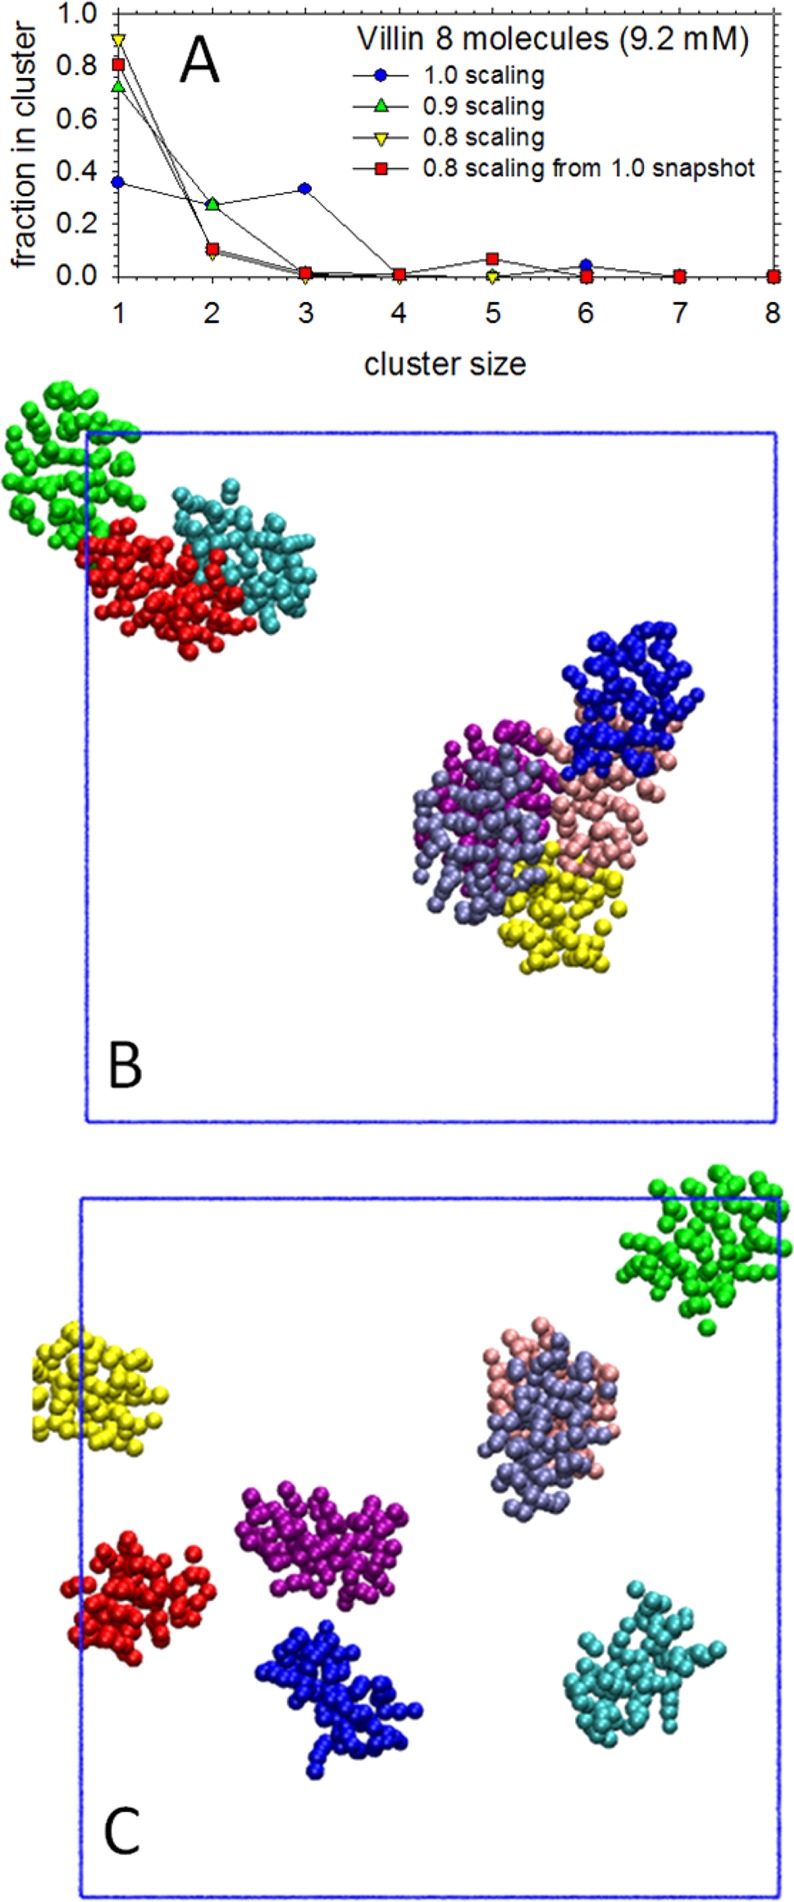
Clustering of villin headpiece solutions at a 9.2 mM concentration in BD. (A) Plot shows the fraction of villin headpiece molecules that are members of clusters of various sizes. Blue circles represent results using a 1.0 scaling factor with COFFDROP’s nonbonded potential functions, green upward triangles represent results using a 0.9 scaling factor, yellow downward triangles represent results using a 0.8 scaling factor, and red squares represent results using a 0.8 scaling factor and starting from a structure in which the villin molecules were already aggregated into a trimer and pentamer. (B) Image showing aggregated villin molecules obtained at the end of a 200 ns BD simulation using a 1.0 scaling factor. Each color represents a different villin molecule. (C) Image showing villin molecules at the end of a 200 ns BD simulation using a 0.8 scaling factor.