Fig 1.

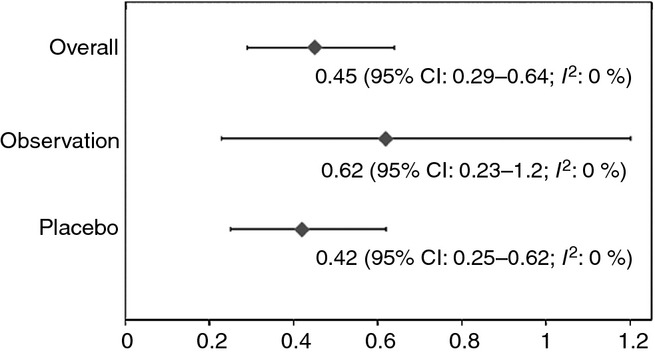
Forest plot of pooled proportions of major bleeding rates in patients randomized to placebo, observation, and overall (per 100 patient-years).

Forest plot of pooled proportions of major bleeding rates in patients randomized to placebo, observation, and overall (per 100 patient-years).