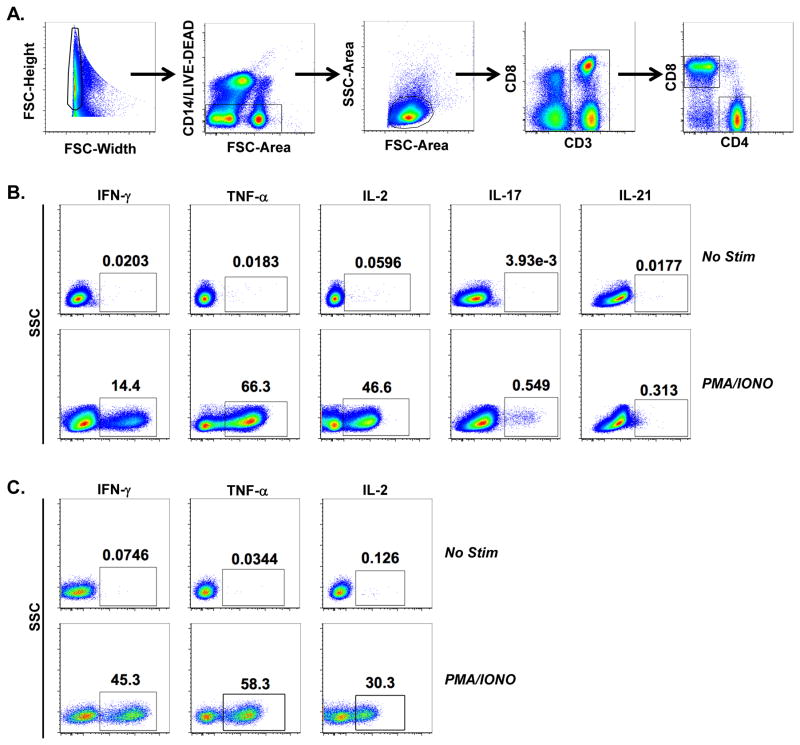
Fig 1.
Representative hierarchal gating for T cell analysis. The following gating strategy was used to isolate T cell populations. (A) Initial gating used forward scatter width (FSC-Width) versus height (FSC-Height) plot to remove doublets. Next, events were gated through a forward scatter area (FSC-Area) versus CD14 and LIVE/DEAD dye to remove monocytes and dead cells, respectively. Subsequently, lymphocytes were gated by a FCS-Area versus SSC plot, followed by a gate on CD3+ cells. CD4 and CD8 T cell gates were drawn off of CD3+ cells. (B) Representative detection of cytokines produced by CD4 T cells (IFN-γ, TNF-α, IL-2, IL-17, IL-21) following no stimulation (upper panel) or PMA/IONO stimulation (lower panel). (C) Detection of cytokines (IFN-γ, TNF-α, IL-2) produced by CD8 T cells following no stimulation (lower panel) or PMA/IONO stimulation (upper panel).

