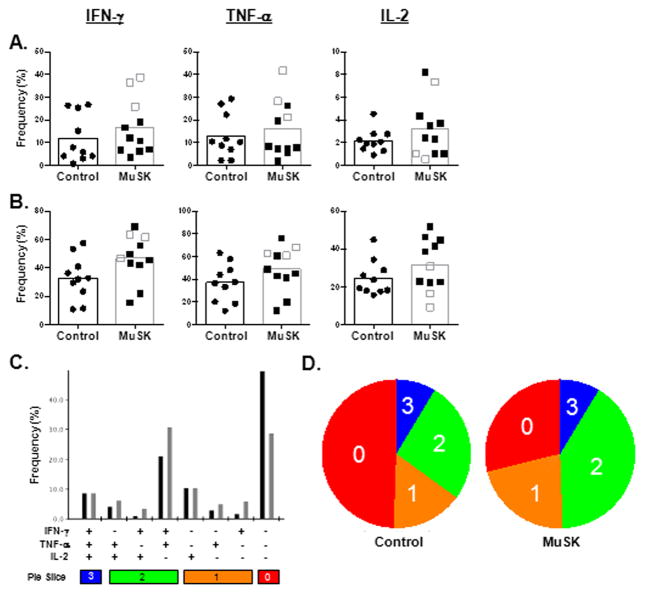
Fig 2.
Comparison of CD8 T cell function in normal and MuSK patients. (A) Intracellular cytokine analysis for IFN-γ, TNF-α, and IL-2 production following αCD3 and αCD28 stimulation of PBMCs in normal (black circle) and MuSK patients (square). Unshaded squares are patients who received Rituximab treatment. Columns represent the mean percentages. Percentages were derived from gated CD8 T cells. (B) Intracellular cytokine analysis for IFN-γ, TNF-α, and IL-2 production following PMA/IONO stimulation of PBMCs. (C) The black (normal) and gray (MuSK) bars represents the mean frequency of the CD8 T cell response expressing different combinations of cytokine production in response to PMA/IONO stimulation of PBMCs. “+” sign denotes IFN-γ, TNF-α, or IL-2 positivity. The number on the color-coded pie slice bars represents the number of cytokine positivity. (D) Each pie chart represents the mean response across ten normal individuals and eleven MuSK patients. Responses are grouped by the number of functions and matched to the “pie slice” color bars in panel C. Statistical significance is represented as follows: *p < 0.05. Results are shown from ten normal individuals and eleven MuSK patients.

