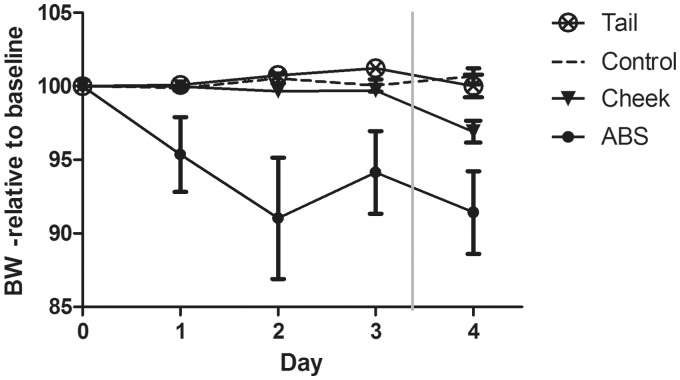
Figure 1.
Body weight (BW) in relation to baseline values. Data are presented as percentages of the average weight recorded for three days prior to intervention. Sample points represent mean ± SEM for control mice (control), mice sampled by facial vein (cheek) and caudal vein (tail) phlebotomy and mice sampled automatically (ABS). The mice in the ABS group was catheterized at day 0 and allowed to recover until day 3, where blood sampling was initiated (vertical grey line).

