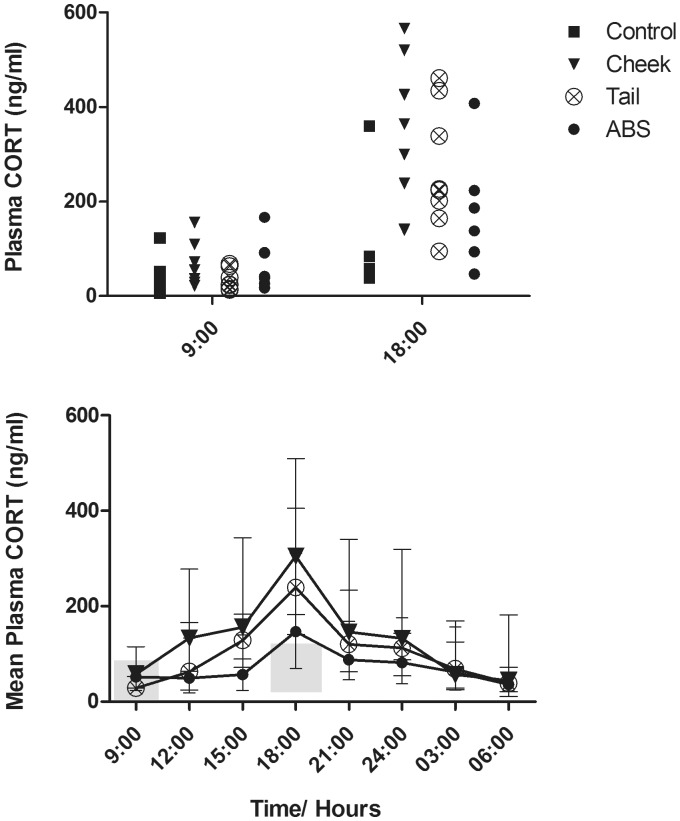
Figure 3.
Plasma corticosterone levels during 24 h of blood sampling in mice sampled by facial vein (cheek) and caudal vein (tail) phlebotomy and automatically (ABS) and from control mice (control). Top: Actual values at 09:00 and 18:00 h, where control mice were sampled. Bottom: data are presented as mean ± SD. The grey areas represent 95% CI of the control mice at 09:00 h (2.89–91.51 ng/mL) and 18:00 h (30.42–118.27 ng/mL), respectively.

