Figure 1.
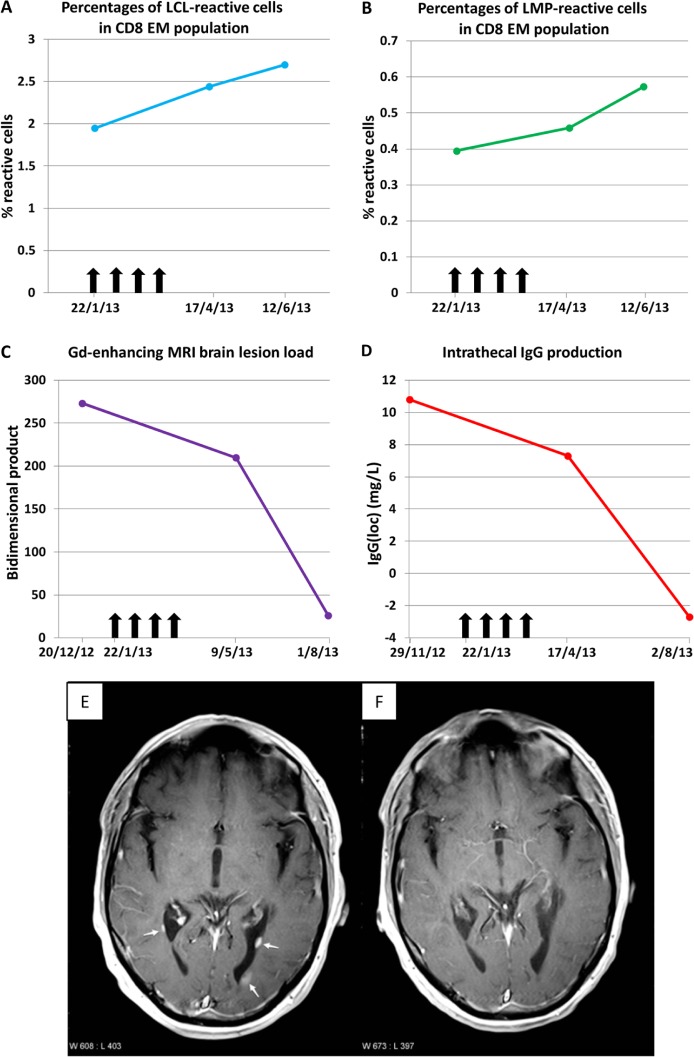
Laboratory and medical imaging findings before and after EBV-specific adoptive immunotherapy. Panels A and B show the frequencies of T cells in the peripheral blood reactive to an EBV-infected autologous B cell lymphoblastoid cell line (LCL) (Panel A) and to a pool of the LMP1 and LMP2A (LMP) peptides contained within AdE1-LMPpoly (Panel B). T-cell reactivity to EBV was measured by flow cytometry and intracellular interferon-γ staining and is shown as the percentages of reactive cells within the CD8+ effector memory (EM; CD45RA–CD62L–) T-cell population. Vertical arrows indicate successive T-cell infusions of 5 × 10⁶, 1 × 10⁷, 1.5 × 10⁷ and 2 × 10⁷ cells. Panel C shows the total gadolinium(Gd)-enhancing brain lesion load, as measured by the bidimensional product, which was calculated as the sum of the product (maximum diameter of a lesion multiplied by the largest diameter perpendicular to this maximum diameter) of each lesion. Panel D shows the quantity of intrathecal IgG production (IgG(loc)) which was calculated by the formula of Reiber and Felgenhauer:10 IgG(loc) (mg/L) = {(CSF IgG ÷ serum IgG) − [0.8 × (√((CSF albumin ÷ serum albumin)2 + 15))] + 1.8} × serum IgG. Panels E and F show axial plane T1-weighted images at the level of the posterior horns of the lateral ventricles 5 minutes after the IV injection of gadolinium. Panel E demonstrates three periventricular gadolinium-enhancing lesions (arrows) 5 weeks before the commencement of therapy whereas Panel F shows no enhancing lesions 9 weeks after the completion of therapy.

