
Figure 3.
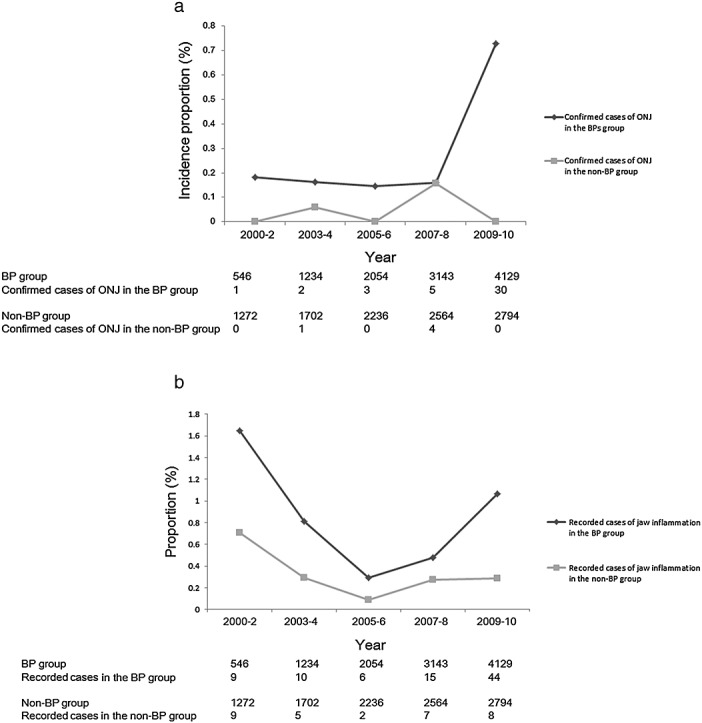
(a). The incidence proportion of confirmed cases of ONJ in the cohort. Legend: The incidence proportions of the confirmed ONJ cases in 100 BP-group patients in 2000–2002, 2003–2004, 2005–2006, 2007–2008 and 2009–2010 are indicated by a dark gray line of diamonds. The incidence proportions of confirmed ONJ cases per 100 non-BP-group patients in each 2- to 3-year period are indicated by a light gray line of squares. The number of patients in the BP group, the number of confirmed ONJ cases in the BP group, the number of patients in the non-BP group and the number of confirmed ONJ cases in the non-BP group are shown below the graph. (b). The proportions of recorded ONJ cases in the cohort. Legend: The proportions of recorded cases of inflammatory conditions of the jaw in 100 BP-group patients in 2000–2002, 2003–2004, 2005–2006, 2007–2008 and 2009–2010 are indicated by a dark gray line of diamonds. The proportions of recorded cases of inflammatory conditions of the jaw in 100 non-BP-group patients in each 2- to 3-year period are indicated by a light gray line of squares. The number of patients in the BP group, the number of recorded cases of inflammatory conditions of the jaw in the BP group, the number of patients in the non-BP group and the number of recorded cases of inflammatory conditions of the jaw in the non-BP group are shown below the graph