Fig 1.

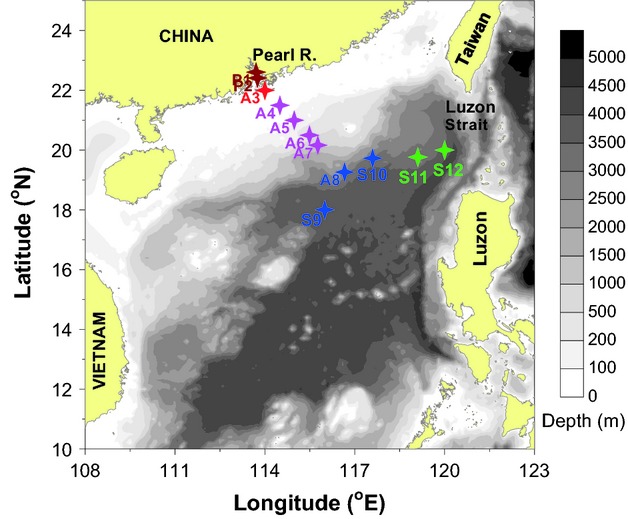
Map of the South China Sea showing sampling stations (coloured stars: consistent colours were used throughout.). Isobaths are used as the background and the grey bar indicates depth.

Map of the South China Sea showing sampling stations (coloured stars: consistent colours were used throughout.). Isobaths are used as the background and the grey bar indicates depth.