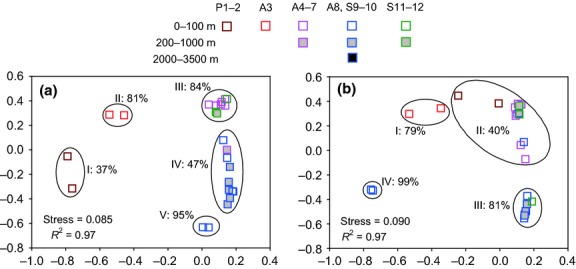
Fig 3.

Nonmetric multidimensional scaling (NMDS) ordination with two dimensions based on thetaYC distances between cyanobacterial DNA- (a) or RNA-based (b) communities. Each square represents an individual sample in the NMDS charts. Roman numerals represent cluster serial number. Percentages represent community similarities calculated from thetaYC distance.
