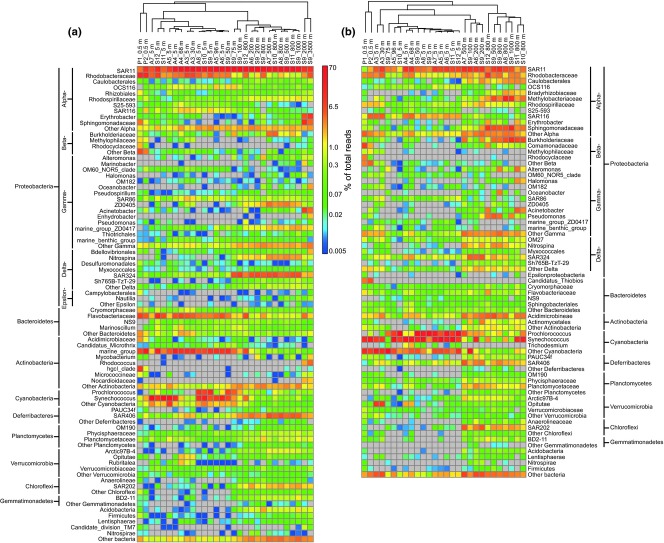
Fig 4.
Heat maps showing phylogenetic distribution of bacteria among DNA- (a) or RNA-based (b) samples. Sequences were classified with SILVA reference sequences and taxonomic outline in MOTHUR. The confidence cut-off was set to 60%. The relative percentage of each classification of bacteria (y axis) within each sample (x axis clustering) was shown. Colour bars represent the relative percentage.

