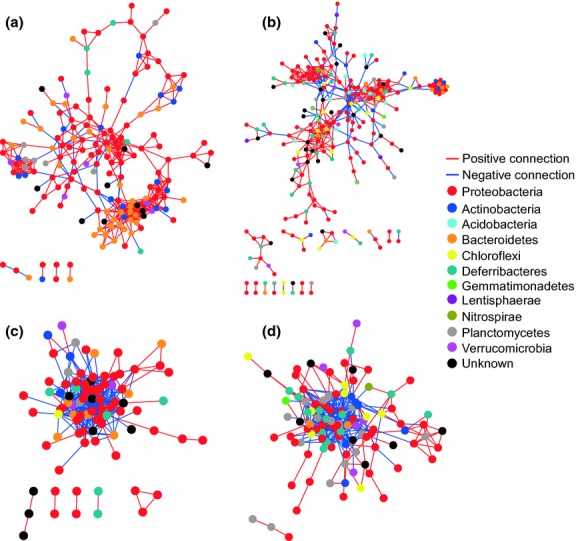
Fig 7.

Network interactions of OTUs (force-directed layout). (a) DNA data set of the shallow water; (b) DNA data set of the deep water; (c) RNA data set of the shallow water; (d) RNA data set of the deep water. Each node represents an OTU indicating an individual species. The edge between each two nodes represents positive (red) or negative (blue) interactions between those two species. Colours of the nodes indicate the different major phyla.
