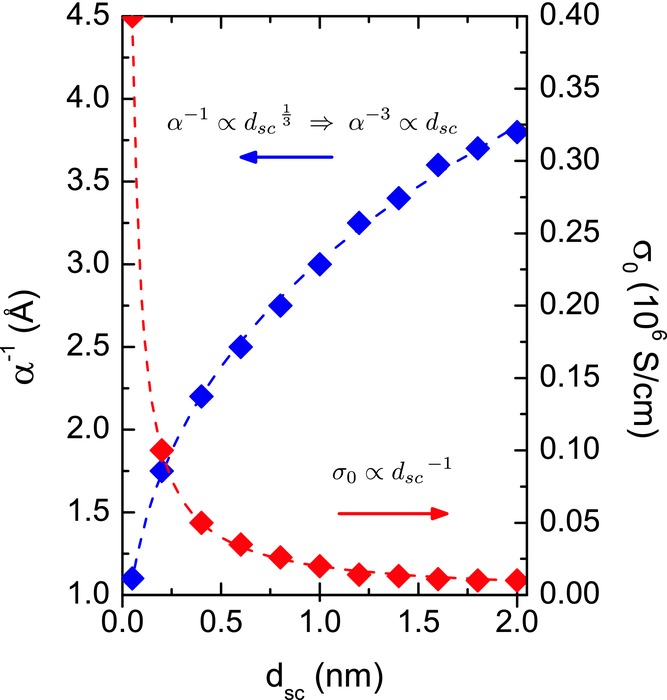
Figure 6.

Visualisation of the parameter space that yields identical fits of the temperature-dependent transfer characteristics of PSeDPPDTT FETs using Equation (1). The resulting fits are shown as solid lines in Figure 1a. A threshold voltage Vt = +1 V was used. Dashed lines are a guide to the eye showing expected relationships between the parameters from Equation (1).
