
Figure 1.
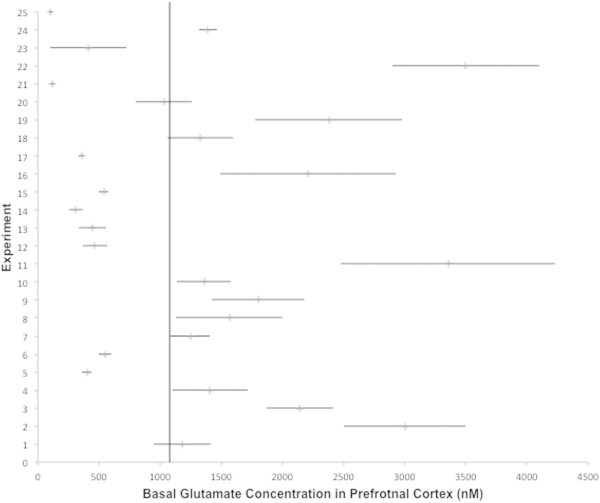
Forest-plot of the basal glutamate values in the prefrontal cortex as measured in 24 experiments, ordered by year of publication. Row 1 indicates the weighted average basal value and its standard error of mean (±SEM). The vertical line extends the weighted mean in order to compare the extracted data. 2 Hashimoto et al. (1995); 3 Stephans and Yamamoto (1995); 4 Robert et al. (1996); 5,6 Selim and Bradberry (1996); 7 Del Arco and Mora (1999); 8 Timmerman et al. (1999); 9 Del Arco and Mora (2000); 10 Del Arco and Mora (2002); 11 Pistis et al. (2002); 12 Harte and O'Connor (2004); 13 Giovannini et al. (2005); 14 Abekawa et al. (2006); 15 Calcagno et al. (2006); 16 Hugues et al. (2007); 17 Ballini et al. (2008); 18 Hernandez et al. (2008); 19 Huang et al. (2008); 20 Welty and Shoblock (2009); 21 Yamamura et al. (2009a); 22 Li et al. (2010a); 23 Lupinsky et al. (2010); 24 Carli et al. (2011); 25 Ohoyama et al. (2011).