
Figure 2.
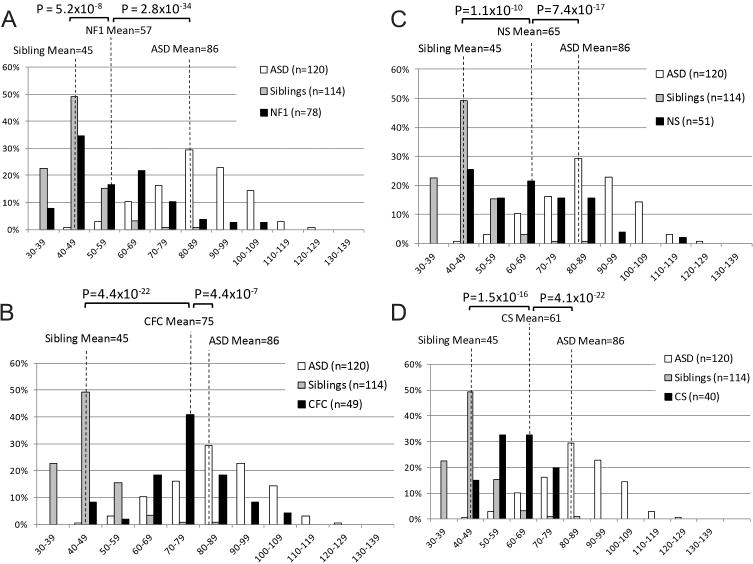
Social Responsiveness Scale (SRS) in the RASopathies. Histograms depicting the distributions of transformed SRS scores for idiopathic autism spectrum disorders (ASDs), unaffected siblings of RASopathy probands, and (A) neurofibromatosis type 1 (NF1), (B) Costello syndrome (CS), (C) Noonan syndrome (NS), and (D) cardio-facio-cutaneous syndrome (CFC). Distributions are given as the percentage of individuals who scored within each bin range. One-tailed p values from a Student t test comparing average T-scores of RASopathy subjects, idiopathic ASD subjects, and unaffected siblings of RASopathy probands are indicated.