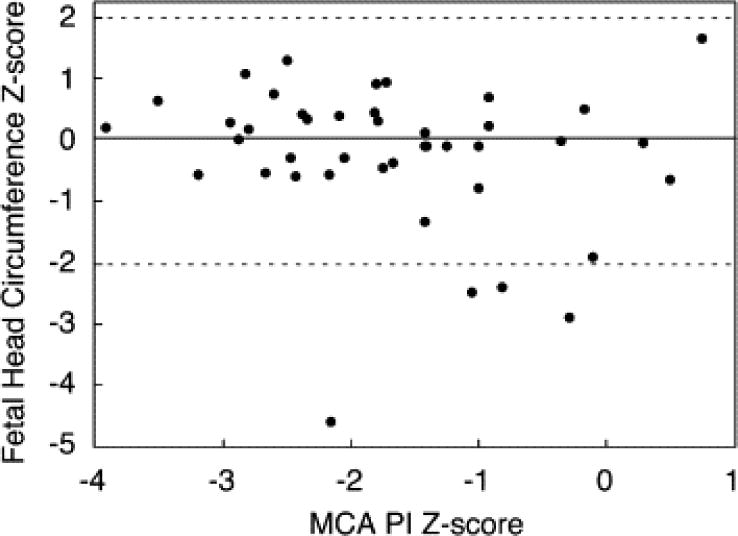
Figure 5.

This scatter plot depicts the relationship between middle cerebral artery (MCA) pulsatility index (PI) Z-score and head circumference Z-score prior to intervention, and also reflects the lack of association between head circumference and other MCA flow indices. The relationship is defined by the following regression equation: Head circumference Z-score = (−0.189 × MCA PI Z-score) − 0.189 (r = −0.17, p = 0.27). The solid line at Z = 0 indicates the mean for the normal population, and the dashed lines at +2 and −2 indicate the limits of the normal range.
