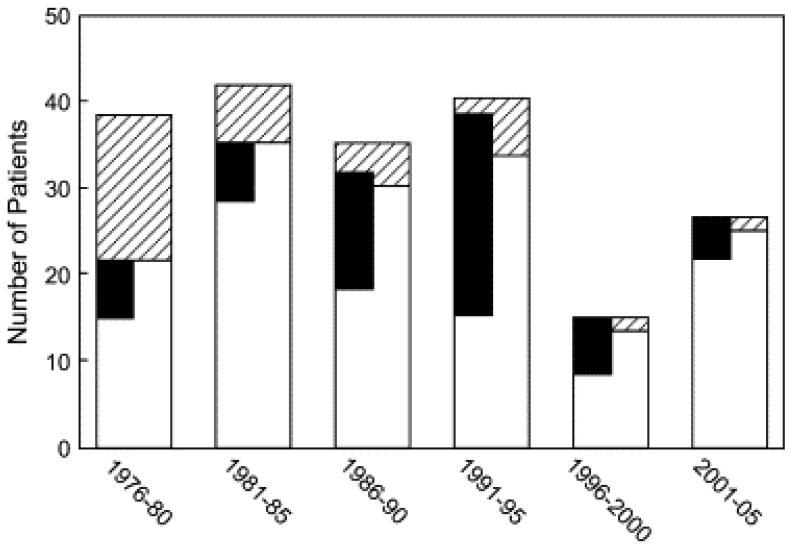
Figure 2.
Bar graph depicting the number of mitral valve replacement (MVR) procedures broken down by early survivors (white bars) and early deaths (hatched bars) in 5-year blocks (the most recent block, 2001–2006, is 6 years). Patients in whom a supra-annular MVR was performed are depicted with black bars, which are accurately aligned across bars for early survivors and early deaths.

