FIGURE 7:
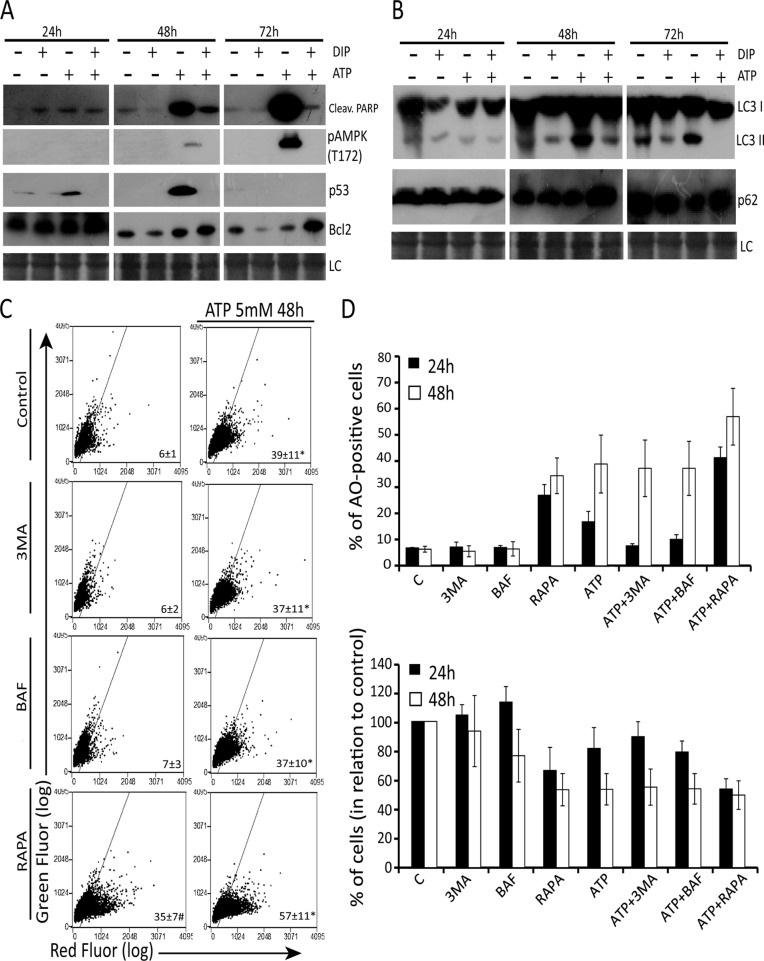
Adenosine uptake triggers AMPK phosphoactivation, p53 increase, and cytotoxic autophagy in SiHa cells. Expression of (A) p-AMPK, cleaved PARP, p53, and Bcl-2 and (B) p62 and LC3 II after 5 mM ATP exposure for 24, 48, and 72 h with or without 10 μM DIP pretreatment, determined by Western blot analysis as described in Materials and Methods. (C) Effect of the class III autophagy inhibitors 3MA and BAF and autophagy stimulator RAPA on AO staining after 48 h of ATP exposure. SiHa cells were pretreated with 2 mM 3MA, 100 nM BAF, or 200 nM RAPA before ATP treatment, and autophagy index was determined by AO staining as described in Materials and Methods. (D) Top, percentage of AO-positive cells after ATP exposure before or not to autophagy inhibitors or stimulator. Bottom, number of viable cells after treatment. Note that treatments that increased autophagy induced a reduction in cell number (see also Supplemental Figure S4). *p <0.05 compared with treatments without ATP; #p < 0.05 compared with control (two-way ANOVA, followed by Bonferroni posttest).

