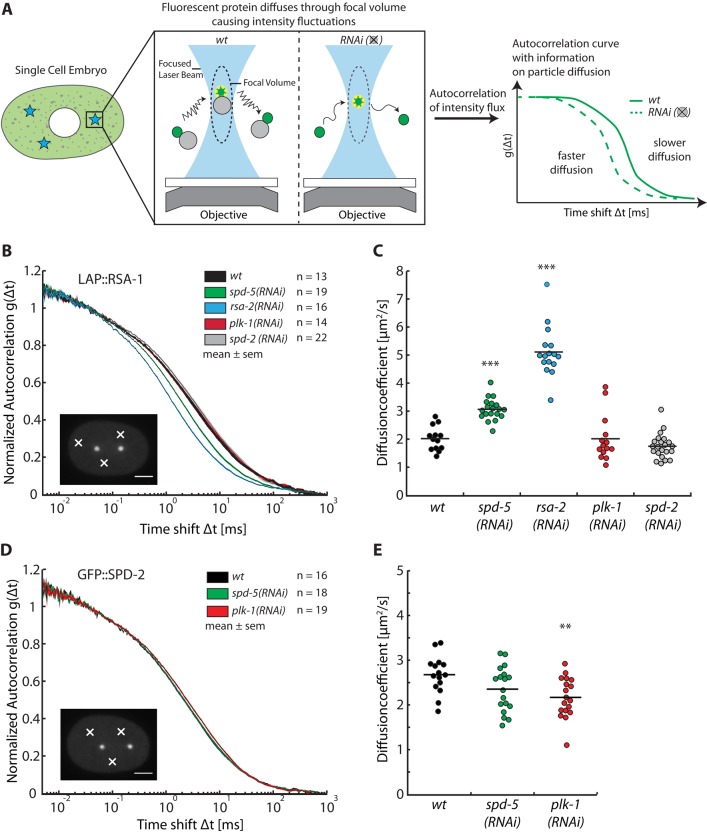
FIGURE 3:
Fluorescence correlation spectroscopy reveals cytoplasmic interactions in vivo. (A) Schematic overview of the experimental procedure. FCS measurements were conducted in the cytoplasm of single-cell embryos at three randomly chosen cytoplasmic positions away from the centrosomes and nucleus. Intensity fluctuations caused by GFP-tagged proteins diffusing through the focal volume were recorded over time. (B) Diffusion of LAP::RSA-1 is affected by depletion or RSA-2 and SPD-5. Autocorrelation curves are depicted as mean ± SEM as calculated from all embryos for each condition. The number of embryos analyzed is indicated next to each condition. Scale bar, 10 μm; white crosses point to exemplary locations of measurements. (C) Diffusion coefficient plot showing diffusion coefficients of LAP::RSA-1. LAP::RSA-1 diffusion changes from 2.0 ± 0.4 to 3.1 ± 0.4 μm2/s (p < 0.001, n = 19) under spd-5 RNAi and 5.1 ± 0.9 μm2/s (p < 0.001, n = 16) under rsa-2 RNAi. Diffusion coefficients were obtained from fitting the autocorrelation curve of LAP::RSA-1 from each embryo. Asterisks indicate significance with p < 0.001. The results show a clear interaction between LAP::RSA-1 and RSA-2, as well as SPD-5. An interaction with PLK-1 or SPD-2 could not be detected. (D) GFP::SPD-2 diffusion is unaffected by depletion of SPD-5 but slightly decreases under PLK-1 depletion. Representation as in B, showing GFP::SPD-2 autocorrelation curves under various conditions. (E) Diffusion coefficient plot of GFP::SPD-2. GFP::SPD-2 diffuses indistinguishably, with ∼2.5 μm2/s in wild- type and spd-5 RNAi conditions. Its diffusion is significantly reduced to ∼2.2 μm2/s under plk-1 RNAi conditions.

