FIGURE 2:

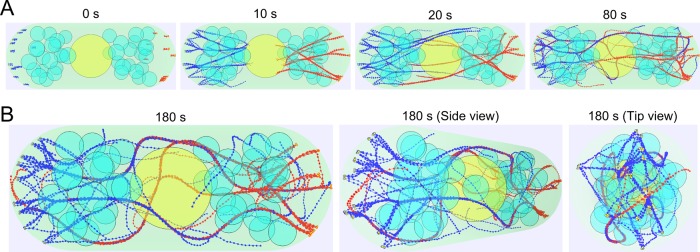
Simulated actin cables using parameter values from Table 1. (A) Time evolution of the simulation. Nucleus (yellow) and vacuoles/organelles (cyan) are simulated as impenetrable immobile spheres. The cytoplasmic region is marked in light green. Actin filaments growing from the left (right) side tip are marked in blue (red). Formin For3p clusters localized at the cell tip are marked in orange. (B) Simulated steady-state actin cables viewed from different perspectives (front, 45°, and 90°) showing a complete 3D cable structure.
