FIGURE 3:

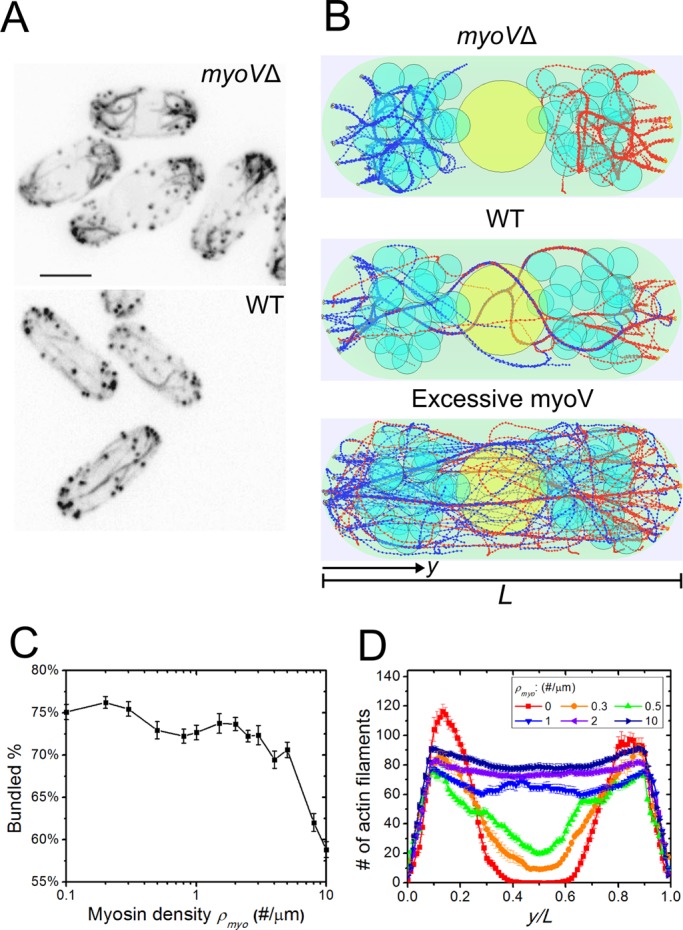
Simulations of myosin V force straightening actin cables (Supplemental Video S1). (A) Experimental images of actin cables in myoVΔ cells in which >95% of the cells showed misoriented and thick cables and >70% of the cells showed an extension defect (reproduced with permission from Lo Presti et al., 2012). (B) Simulated steady-state configurations of myosin density ρmyo = 0, 1, and 10 μm−1, showing misoriented cables at the tip, normal actin cables, and straightened but thin actin cables. (C) Bundled actin filament percentage as a function of myosin V density ρmyo. Fewer actin filaments are bundled for high ρmyo. Error bars are SEM from five runs. (D) Graph of actin filament bead concentration along the long axis of the cell (average of three simulations). More actin filaments are able to span the cell as ρmyo increases.
