FIGURE 7:
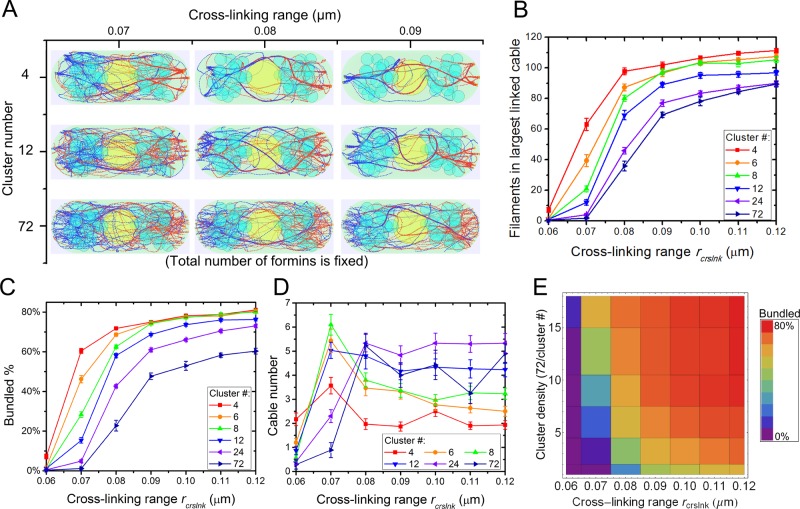
Clustering of For3p and increase in cross-linking strength promote actin cable formation in simulations. (A) Steady-state configurations under different cluster densities and cross-linking interaction range rcrslnk with 72 formin nucleation sites per cell tip partitioned in the indicated number of clusters. High For3p clustering (cluster number, 4) and large rcrslnk show fewer and thicker actin cables. (B) Number of actin filaments in largest linked cable increases with increasing rcrslnk and cluster density. (C) Bundled actin filament percentage increases with increasing rcrslnk and cluster density. (D) Cable number as a function of rcrslnk and cluster density. (E) Bundled percentage landscape as function of cluster density and rcrslnk corresponding to C. In B–D, error bars are SEM from five runs.

