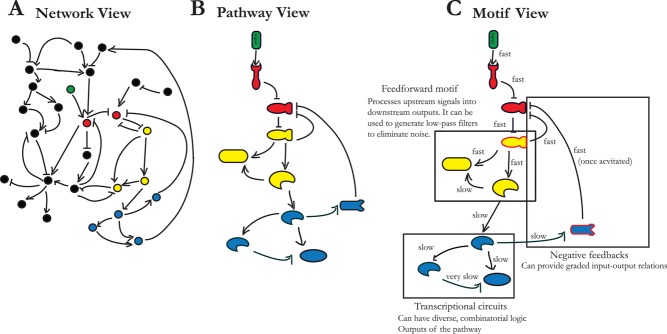
FIGURE 1:

Hierarchies of organization from network to pathway to motifs. (A) In the network view, pathways are usually not readily discernible because of many apparent interactions between pathways from genomic studies (the pathway in question similarly colored in all panels). We note that in many network analyses, there is no information about the functional significance of interactions. (B) Even though the identity of components (receptors, kinases, transcription factors, downstream targets) is usually indicated in the pathway view, it is a static description of a dynamic system. (C) The separation of time scales may allow the analysis of groups of network components as functionally distinct motifs. The example shown here is idealized because for most pathways; not all components can be so easily broken down into motifs. In this example, “fast” indicates the phosphorylation time scale (∼1 min), and “slow” signifies transcription time scale (∼15 min to 1 h) typical of yeast.
