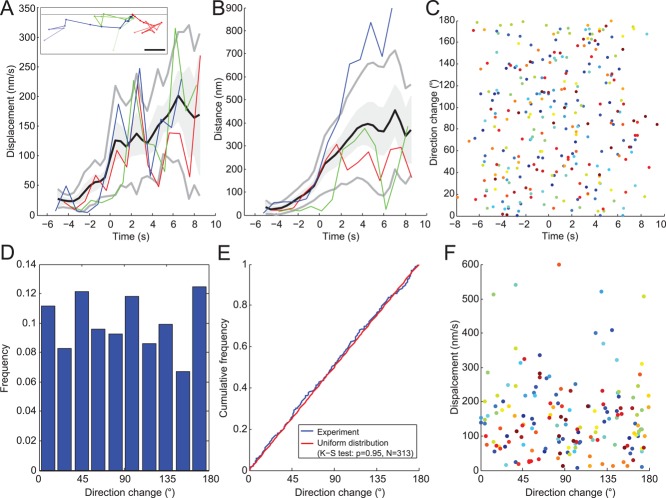
FIGURE 4:
Diffusive movements of the same sample of 24 endocytic patches as Figure 3D. (A) Endocytic patch displacements and (B) distances from their origins (i.e., position of first appearance). Black lines are average displacements and distances after continuous alignment; gray lines are ± 1 SD; gray shading is ± 1 SEM. Both figures feature three patches shown in inset in A and identified as red, green, and blue. Dots in the inset of A show the positions of the centers of these three patches in the x,y-plane at successive 1-s time intervals. All three tracks are aligned at a common origin at time zero. The brightness of the color decreases over time from dark at the beginning to light at the end. Gray horizontal line: position of the plasma membrane. Scale bar: 200 nm. (C) Changes in direction of 24 endocytic patches over time. Each dot is a different time point and each color corresponds to one of the 24 patches. (D) Histogram of the frequency of changes in direction angles for the 24 patches. (E) Cumulative frequency of changes in direction angles of the 24 patches. The distribution does not differ significantly from a uniform distribution, as expected for a diffusive motion. Blue: same data as C; red: a uniform distribution between 0 and 180°. (F) Plot of displacement vs. direction change of the 24 patches shows no obvious correlation. Only data after time zero are represented.

