FIGURE 7:

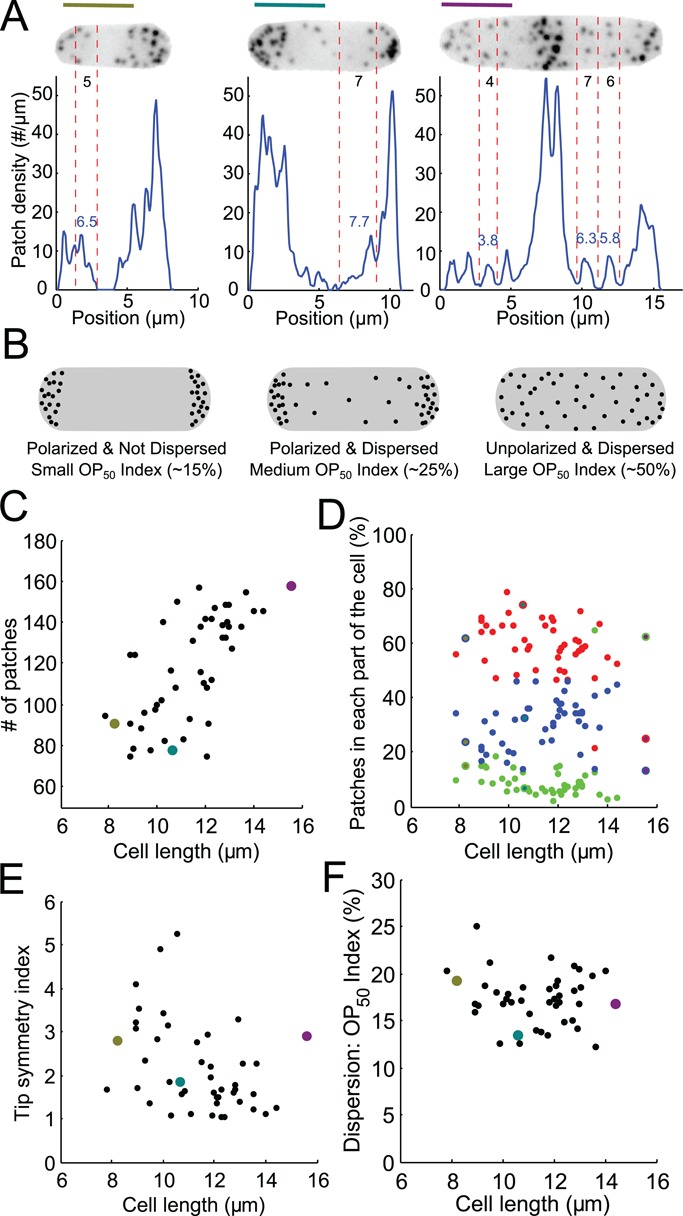
Distribution of patches along the long axis of asynchronous fission yeast cells imaged at single points in time. (A) Distributions of patches in small-sized (olive) and medium-sized (teal) cells in interphase and a cell in mitosis (purple). The images are sum projections of cells expressing Fim1p-mEGFP at their native locus from 18 consecutive confocal z-slices spaced at 360-nm intervals. Blue lines: distributions along the long axis measured from the fluorescence intensity and the mean fluorescence per patch. Black numbers: direct manual counts of patches in the zones between two red vertical dashed lines from stacks of confocal images. Blue numbers: count of patches in the same zone estimated from the patch density distribution. Scale bars: 5 μm. (B) Schematic explaining our definitions for polarization and dispersion and how the OP50 index changes accordingly. (C) Numbers of patches in 47 cells vs. their lengths, a proxy for stage of the cell cycle. Points colored olive, teal, and purple are data from the cells in A. (D) Distribution of patches in the cell vs. cell length. Red, left third of the cell; green, middle third of the cell; blue, right third of the cell. (E) Tip symmetry index, the ratio of the number of patches in each tip, vs. cell length. A perfectly symmetrical distribution would have a symmetry index of 1. (F) Dispersion index vs. cell length. The OP50 index represents the percentage of the length of a cell containing 50% of total patches (see Materials and Methods).
