
FIGURE 4:
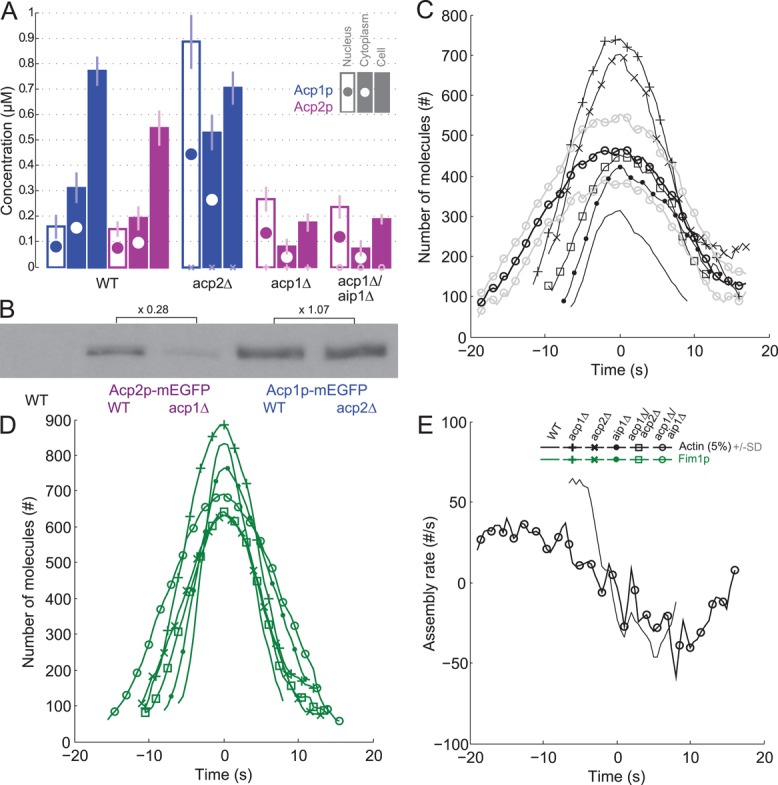
Evidence for functional differences between capping protein subunits. (A) Nuclear, cytoplasmic, and total cell concentrations of Acp1p-mEGFP and Acp2p-mEGFP in wild-type cells and single mutants acp1Δ and acp2Δ, and double mutants acp1Δ/aip1Δ. Color code: blue, Acp1p-mEGFP; purple, Acp2p-mEGFP. Empty bars with a filled circle, nuclear concentration; filled bar with an empty circle, cytoplasmic concentration; filled bar, total cell concentration. (B) Western blots with antibodies against GFP for Acp2p-mEGFP in wild-type and acp1Δ cells, and Acp1p-mEGFP in wild-type and acp2Δ cells. Intensities of the bands are proportional to total cell concentrations for comparison with the filled bars in B. Numbers represent the relative intensities of bands in corresponding mutants. (C–E) Time courses with time 0 s at the peak of actin assembly. Symbols and lines: dark lines are average values; light lines are ± 1 SD of the mean values; plain lines, wild-type cells (same as Figure 1A); +, acp1∆ cells; x, acp2∆ cells; ●, aip1∆ cells; ◻, double mutant acp1∆/acp2∆ cells; ○, double mutant acp1∆/aip1∆ cells. Color code: black, mEGFP-actin; and green, fimbrin Fim1p-mEGFP. Time zero is the peak of actin. (C) Numbers of mEGFP-actin molecules in all mutants over time. (D) Number of molecules of Fim1p-mEGFP in all mutants over time. (E) Net actin assembly rates in wild-type and acp1Δ/aip1Δ strains over time.