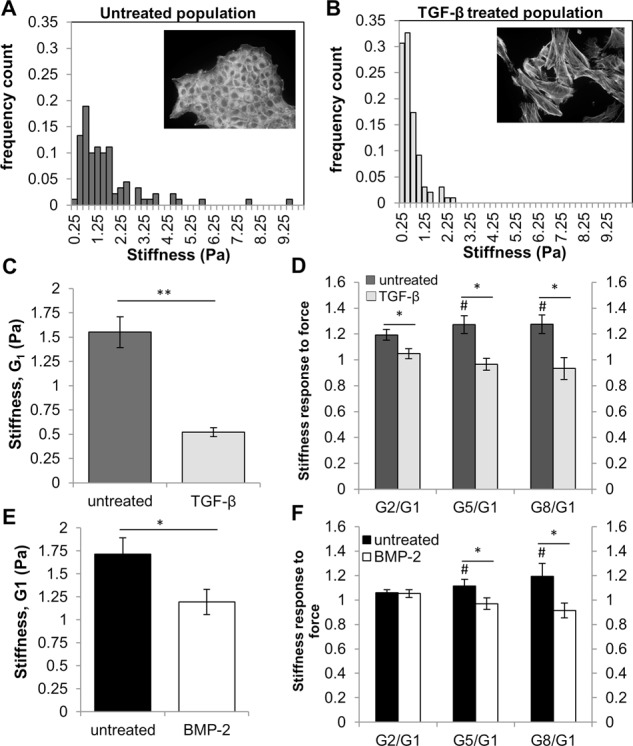
FIGURE 2:

Stiffness and stiffness response to force decrease during TGF-β induced EMT. (A, B) NMuMG cells were treated with 100 pM TGF-β for 48 h to induce EMT. Histogram of NMuMG cell stiffness for (A) epithelial state (untreated) and (B) mesenchymal-state. Insets, fluorescence images are cells stained with phalloidin to show actin structures. (C) Average cell stiffness of NMuMG cells for untreated (n = 90) and TGF-β treated (n = 98) populations. **p < 0.001. (D) Average stiffness response for untreated (n = 30) and TGF-β treated (n = 25) populations. #Stiffness difference of Gx from G1 at the p < 0.05 level. *Stiffness response (Gx/G1) difference between conditions at the p < 0.05 level. (E) PANC-1 cells were treated with 300 ng/mL BMP-2 for 72 h to induce EMT. Average PANC-1 cell stiffness for untreated (n = 86) and BMP-2 treated cells (n = 61). *Stiffness difference relative to untreated cells at the p < 0.05 level. (F) Average PANC-1 stiffness response for untreated (n = 20) and BMP-2 treated (n = 15) cells. #Stiffness difference of Gx from G1 at the p < 0.05 level. *Stiffness response (Gx/G1) difference between conditions at the p < 0.05 level. Error bars represent SEM; data were collected from three independent experiments.
