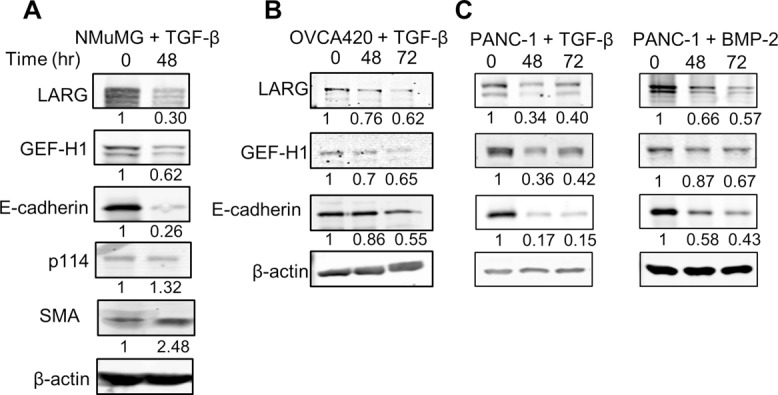
FIGURE 4:

LARG and GEF-H1 expression decreases during EMT. (A, B) Indicated cell lines were treated with 100 pM TGF-β for 48 or 72 h. Cells were then lysed, and protein expression levels were analyzed by Western blot. A representative blot of four independent experiments. (C) PANC-1 cells were treated with 300 ng/ml BMP-2 for 48 and 72 h. Cells were then lysed, and protein expression levels were analyzed by Western blot. A representative blot of four independent experiments.
