
FIGURE 2:
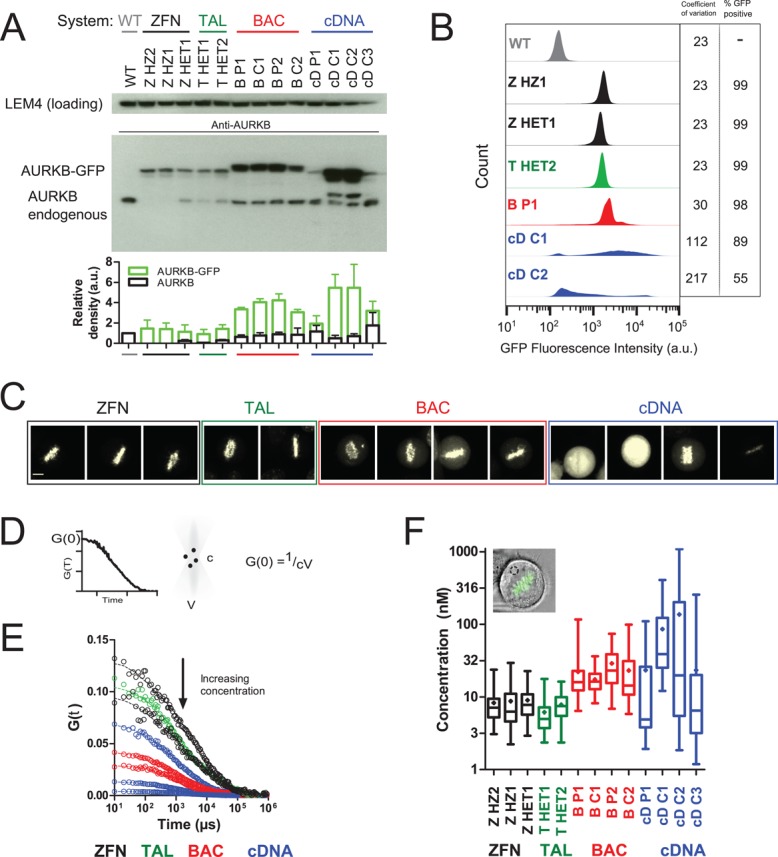
Expression system determines AURKB-GFP levels. (A) Western blot comparison of AURKB levels in nocodazole-arrested cells. BAC-expressed AURKB-GFP runs at a higher molecular weight due to the presence of an S-peptide in addition to the EGFP tag. The graph shows the mean ± SD of three independent experiments. (B) Flow cytometry analysis of AURKB-GFP intensity in nocodazole-arrested cells. Coefficient of variation is from the whole population. GFP+ was defined as 3 SD above autofluorescence from wild-type cells. (C) Sum intensity confocal images of AURKB-GFP using the same imaging conditions throughout. One metaphase cell is shown per panel. Left to right: ZHZ2, ZHZ1, ZHET1, THET1, THET2, BP1, BC1, BP2, BC2, cDP1, cDC1, cDC2, and cDC3. Scale bar, 7 μm. (D) The amplitude of the FCS autocorrelation function (see Materials and Methods), G(0), is inversely proportional to particle number. Absolute protein concentration, c, is calculated using the measured confocal volume, V. (E) AURKB-GFP FCS autocorrelation curves from single representative cells. Top to bottom: ZHZ2, THET1, ZHET1, cDC3, BP2, BC2, cDC2, and cDC1. (F) AURKB-GFP cytoplasmic concentration calculated by fitting FCS autocorrelation curves with a one-component anomalous model of diffusion as described in Materials and Methods. The box and whiskers plot is from >23 cells/sample from two experiments. The mean is depicted as a diamond and the median as a horizontal line, and the whiskers show the minimum and maximum.