
FIGURE 1:
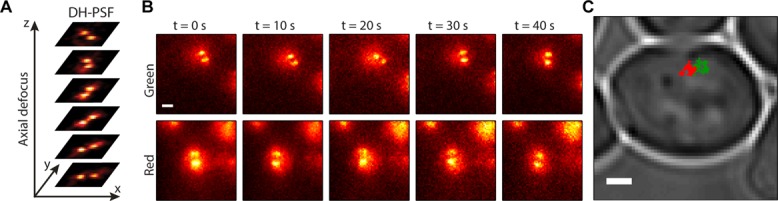
(A) Behavior of the DH-PSF as a function of axial defocus (z). (B) Fluorescence images from the green (top) and red (bottom) channels at 10-s intervals of one example track pair. Scale bar, 1 μm. (C) The 2D projection of trajectories from B overlaid on white light image of whole cell. Scale bar, 1 μm.