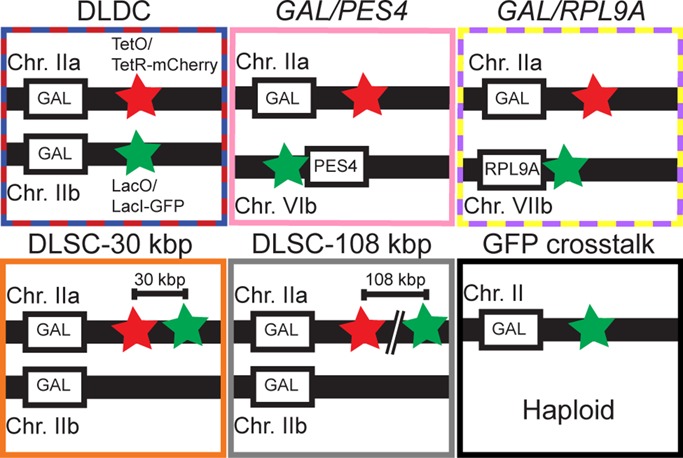
FIGURE 2:

Labeling scheme for each condition imaged. Green star corresponds to LacO/LacI-GFP label, and red star corresponds to TetO/TetR-mCherry label. TetO repeats were integrated at the same position relative to the GAL locus (<3 kbp from GAL1) wherever present. LacO repeats were integrated in the same position (i.e., <3 kbp from GAL1) for the DLDC and GFP cross-talk experiments. LacO repeats are immediately adjacent to the 5′ end of PES4 for the GAL/PES4 experiment. The DLDC and GAL/RPL9A cases were imaged in galactose and dextrose, whereas all other (control) cases were imaged in dextrose. Distances between loci and labels in schematic are not necessarily to scale.
