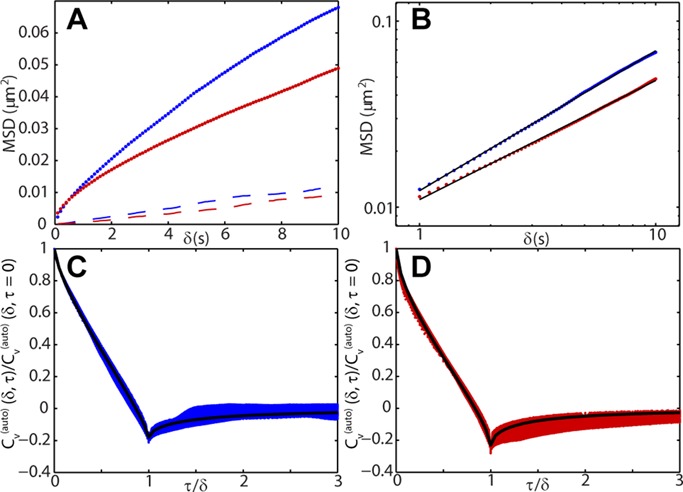
FIGURE 6:

MSD and velocity autocorrelations for DLDC data. (A) Time-ensemble-averaged MSD for DLDC-dextrose (blue dots) and DLDC-galactose (red dots) plotted on linear scale. Upper bounds of contribution of nuclear translation to total MSD calculated as described in the Supplemental Material for dextrose (dashed blue line) and galactose (dashed red line). (B) Time-ensemble-averaged MSD for DLDC-dextrose (blue dots) and DLDC-galactose (red dots) plotted on log-log scale over the time scale used for subdiffusive parameter estimation. Fitted lines are overlaid in black, giving estimated parameters of D* = 0.0020 and α = 0.75 for dextrose and D* = 0.0018 and α = 0.64 for galactose. (C) Scaled velocity autocorrelation for DLDC-dextrose for δ on the interval [1, 10 s] at 0.1-s intervals. Curve fitting to Eq. 6 gives solid black line. (D) Same as in C but for DLDC-galactose.
