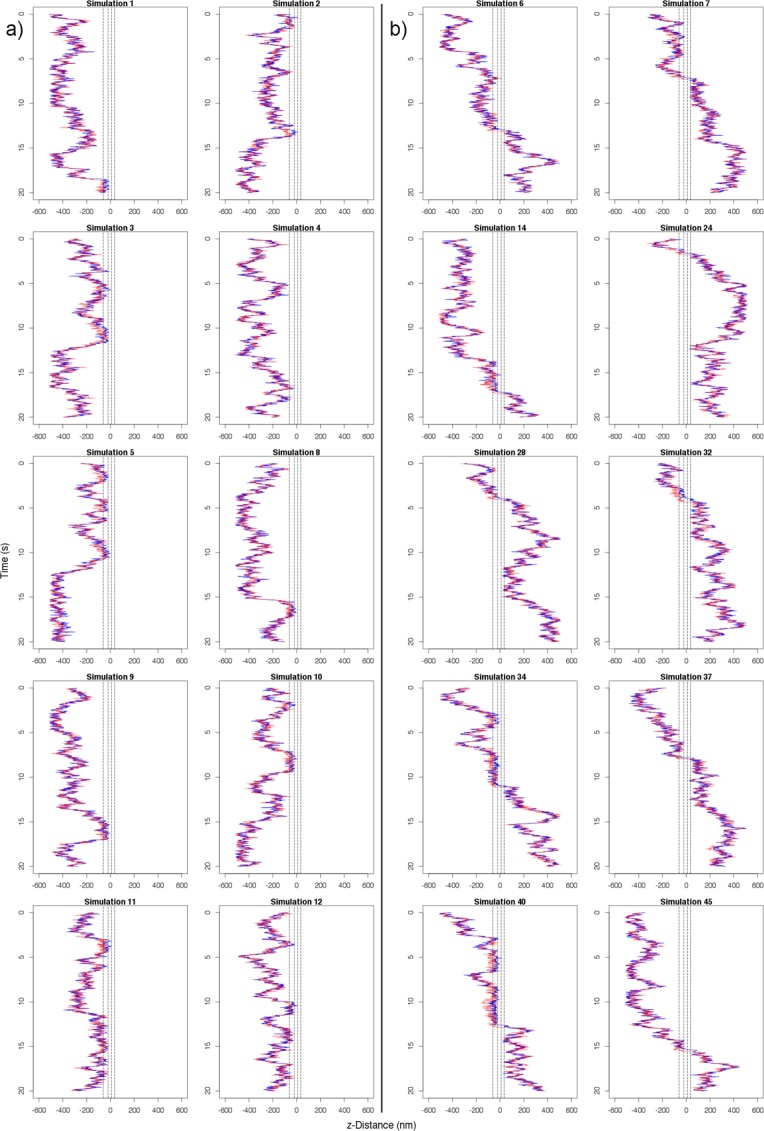
FIGURE 10:

Kymographs of 20 replicate simulations of mRNA export using the default configuration of transport receptor/FG Nup affinity of 100 μM and nine transport receptors along the length of the mRNA. The blue lines represent the position of the 5′ end, and the red lines represent the position of the 3′ end. The NPC central channel is centered at z = 0 nm in each plot. Plots are distributed to show (A) 10 failed exports and (B) 10 successful exports.
