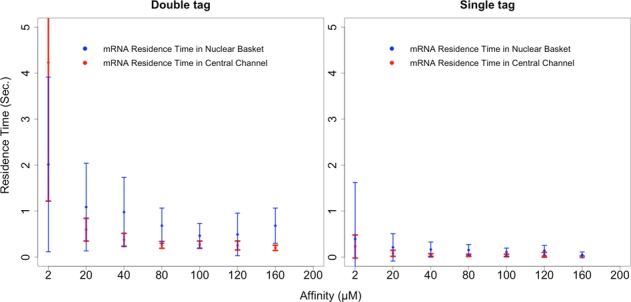
FIGURE 3:

Two graphs that capture the effect of NXF1/FG Nup affinity on the mRNA's nuclear basket and central channel residence times during successful export events. The graph on the left corresponds to what is observed through probes placed at 5′ and 3′ ends of the mRNA, and the graph on the right corresponds to what is observed through a single probe located randomly along the length of the mRNA. Error bars represent 1 SD.
