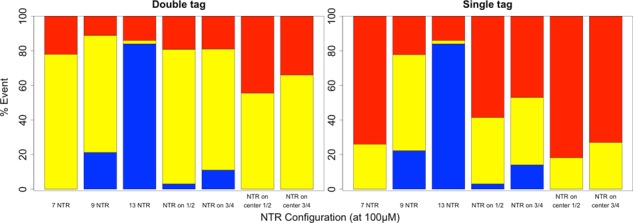
FIGURE 6:

Bar graphs showing the relative percentage of successful (blue), partial (yellow), and unsuccessful (red) transport events observed for different distributions of NTRs on an export-competent mRNA. Note that all configurations used the baseline NXF1 to FG Nup affinity of 100 μM. “NTR on ½” and “NTR on ¾” represent configurations where transport receptors were placed on the terminal one-half and three-fourths length of the mRNA, respectively, with the same spacing as was used in the baseline configuration for a total of five transport receptors in the one-half configuration and seven transport receptors in the three-fourths configuration. “NTR on center ½” and “NTR on center ¾” represent configurations where transport receptors were placed in the center one-half and three-fourths length of the mRNA, respectively, with the same spacing as used in the baseline configuration for a total of five transport receptors in the one-half configuration and seven transport receptors in the three-fourths configuration (i.e., these configurations lacked transport receptors near the 5′ and 3′ termini). The graph on the left captures observations recorded with a double tag (5′ and 3′ end) system, and the graph on the right captures those recorded with a single tag.
