FIGURE 1:
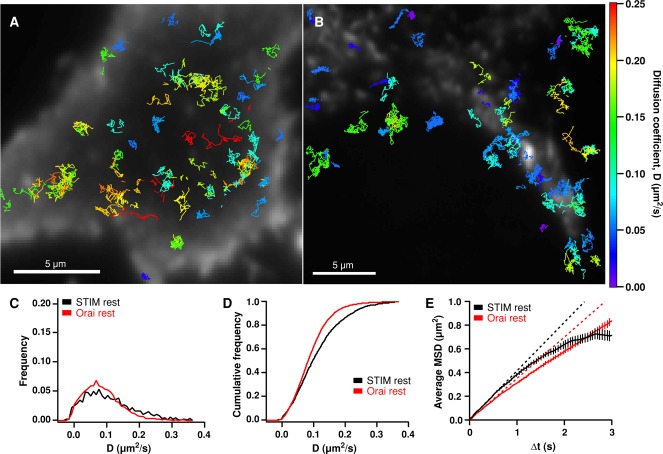
Diffusion of STIM1 and Orai1 in resting cells. (A) A resting HEK cell in 2 mM Ca2+ Ringer's expressing a low level of GFP-STIM1 and a moderate level of mCherry (mCh)-myc-Orai1. Colored GFP-STIM1 tracks are overlaid on the mCh-myc-Orai1 TIRF image. (B) A resting HEK cell expressing a low level of Orai1-GFP and a moderate level of mCh-STIM1. Orai1-GFP tracks are overlaid on the mCh-STIM1 TIRF image. Tracks in A and B are color-coded by their average diffusion coefficient according to the color scale at far right. (C) Diffusion coefficient histograms for STIM1 (black) and Orai1 (red) in resting cells. STIM1 mean D = 0.116 μm2/s (1744 tracks, 3 cells); Orai1 mean D = 0.090 μm2/s (4994 tracks, 6 cells). (D) Cumulative histograms of the diffusion coefficients shown in C. (E) Average MSD vs. ∆t for all STIM1 and Orai1 tracks in resting cells (weighted average ± weighted SD; see Materials and Methods). The dashed lines indicate linear least-squares fits to points 2–5 (∆t = 50–200 ms) of the MSD vs. ∆t curves for STIM1 and Orai1.

