
Figure 3.
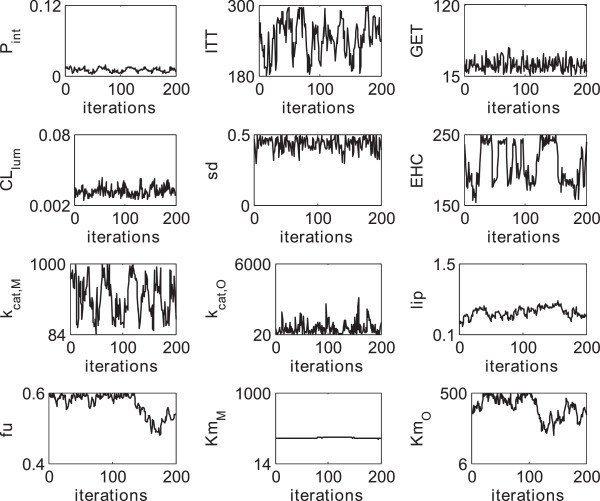
Exemplary representation of a subsample of the posterior distribution. After a burn-in period of 150000 steps, a subsample of 200 parameter vectors was drawn for each patient. The figure shows the traces for all eight individual parameters exemplarily for one patient as well as the four global parameters which were the same for all patients. The limits on the y-axis represent the physiological constraints (θ min , θ max).