
Figure 4.
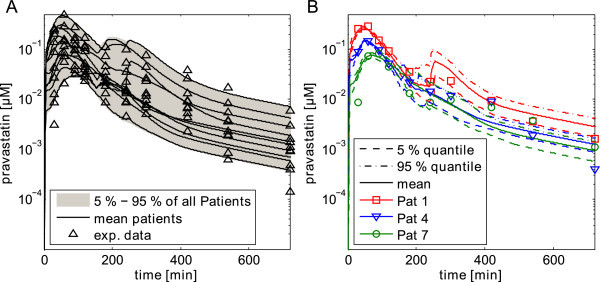
Inter-individual variability of pravastatin pharmacokinetics. (A) Simulations were performed for each patient, simulating the pravastatin PBPK model with each of the 200 parameter vectors which were subsampled out of the posterior distribution. Next, the 5–95% quantile was calculated over all patients (with all 2000 samples) and plotted. Additionally, the mean value PK curve was monitored for every patient together with the experimental data. (B) Simulations were performed for three exemplary patients by simulating the pravastatin model with each of the 200 parameter vectors which were subsampled out of the posterior distribution. The 5% and 95% quantiles were calculated and plotted out of the respective subsample for each patient, together with the mean value curve and the experimental data.