
Figure 5.
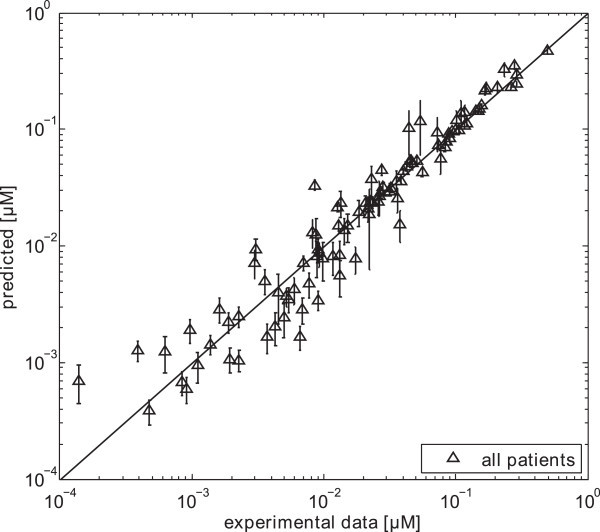
Correlation between predicted mean values and experimental data. Mean concentration values at the same time points as the experimental data were monitored for all patients.
Official websites use .gov
A
.gov website belongs to an official
government organization in the United States.
Secure .gov websites use HTTPS
A lock (
) or https:// means you've safely
connected to the .gov website. Share sensitive
information only on official, secure websites.
Correlation between predicted mean values and experimental data. Mean concentration values at the same time points as the experimental data were monitored for all patients.