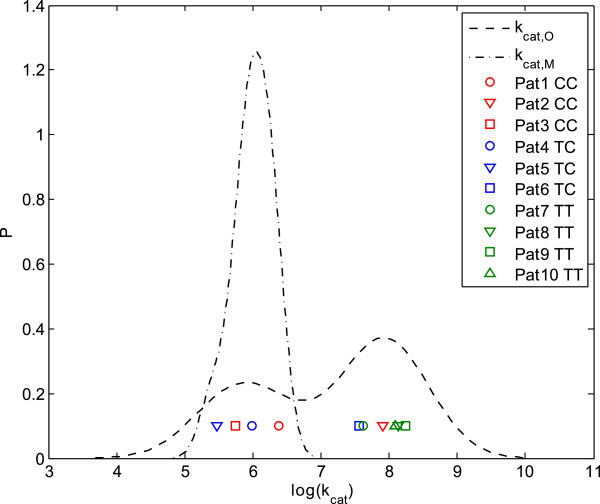
Figure 7.

Identification and assignment of patient subgroups by monitoring the logarithmic mean for each patient. A density estimation of the logarithmic mean values supported the identification of specific patient subgroups. The logarithmic mean values of the transporter activities for MRP2 and OATP1B1 were calculated from the subsample of the posterior and the kernel densities were quantified. Since the density for OATP1B1 provided the separation of the patient logarithmic mean values into two groups, single values were also plotted with symbols. Additionally, they were colored related to their specific genotype.
