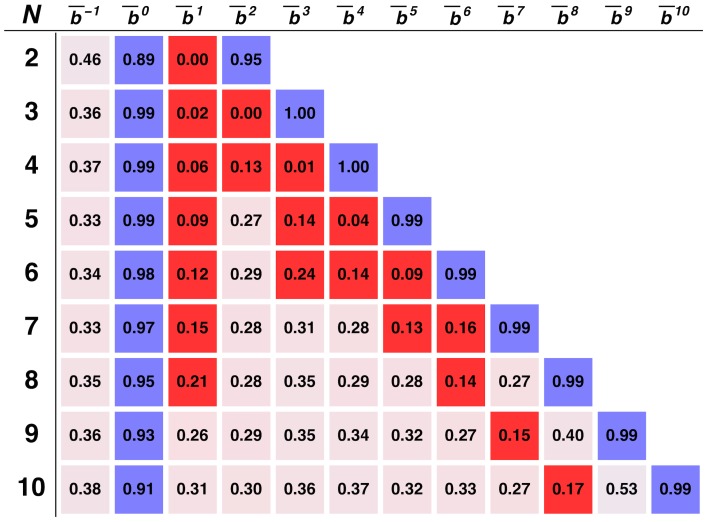
Figure 1. Stationary bit distribution as a function of N.
Each bit (square) corresponds to the weighted sum of the fraction of time (i.e. the analytically computed stationary distribution) the population spends in strategy configurations in which bq = 1. Blue (red) cells identify those bits that are employed at least ¾ of the time with value bq = 1.0 (bq = 0.0). The analysis provided extends for groups sizes (N) between 2 and 10 (rows). Other model parameters: Z = 100, β = 1.0, F/N = 0.85, w = 0.96, ε = 0.05, μ≪1/Z.

