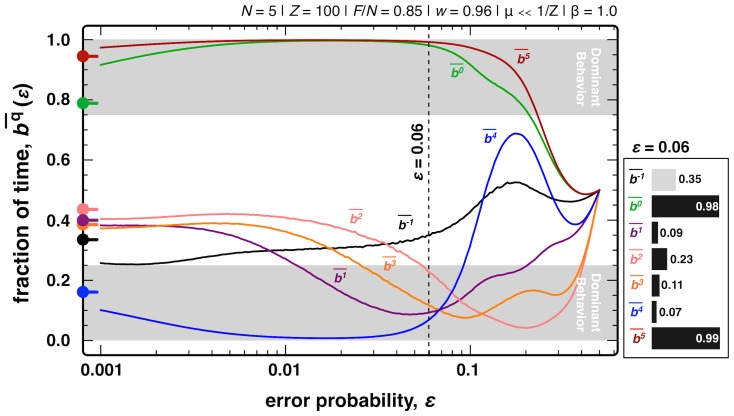
Figure 2. Stationary bit distribution as a function of the error rate.
We plot (log-linear scale) the fraction of time the population spends in a strategy with bq = 1 for a broad range of error probabilities ε. Circles on the left indicate the values obtained for ε = 0.0, gray areas show the range of values for which bits were defined to have a dominant behavior. Note that for ε = 0.5 all strategies behave randomly. The bar plot on the right shows the results for ε = 0.06 (vertical dashed line). Other model parameters: Z = 100, β = 1.0, N = 5, F/N = 0.85, w = 0.96 and μ≪1/Z.

