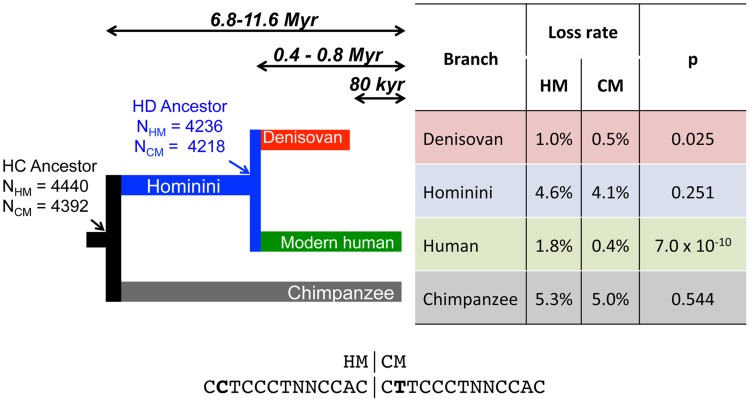
Figure 1. Differential loss of HM motifs across recent human history.
The number of intact HM and CM motifs found in the reconstructed sequence (F2 subset) of human and chimpanzee last common ancestor (HC) and in the last human-Denisovan common ancestor (HD) is indicated with a simple arrow. Loss rates of HM and CM motifs are indicated for each branch. HM and CM loss rates were compared with a proportion test (p-value: p). Sequences of both motifs are shown below the tree. Double arrows represent populations divergence times [28], [29].

