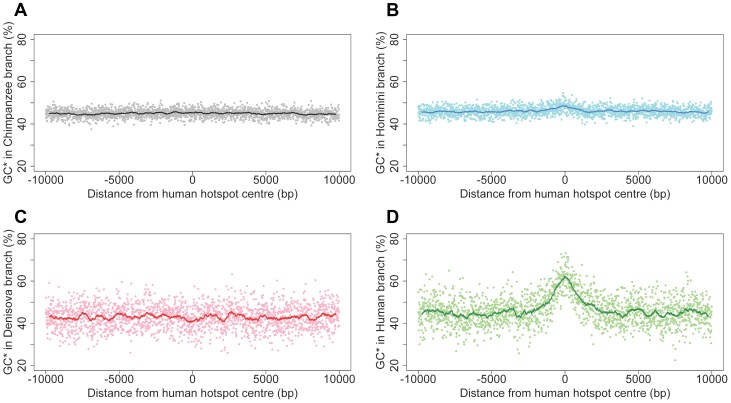
Figure 6. Equilibrium GC-content (GC*) around human recombination hotspots in different branches of the phylogeny.
GC* is computed on each branch of the phylogeny (Figure 1): (A) Chimpanzee branch; (B) Hominini branch; (C) Denisovan branch; (D) Modern human branch. Profiles show the mean GC* computed on 32,987 human historical hotspots, over a 20 kb region centered on the middle of hotspots. Each dot is the average GC* over a 10 bp window. The line shows average GC* over 500 bp window.

